English
 Français
 عربى
عربى 简体中文
简体中文


Coke Oven Flue Gas Composition: Data-Driven Guide for Emission Control
HOME / NEWS / Industry News / Coke Oven Flue Gas Composition: Data-Driven Guide for Emission Control
 By Admin
Content
A stack test for a coke oven battery returns 11.4% CO2 and 2.8% O2 on a dry basis, but the flue gas treatment system was designed around 9.0% CO2 and 4.5% O2. The reagent feed now has to be resized and the SCR catalyst volume increased, adding weeks of outage. This is the cost of treating the coke oven flue gas composition as an assumption instead of a measured design input.
This guide lays out the raw gas baseline, the post-combustion flue gas numbers, and the direct link between each measured component and the purification equipment selected for a coking plant. It is written for plant engineers, EHS managers, and EPC designers who need a defensible basis for emission control work.
Raw coke oven gas is the fuel gas drawn from the coking chamber, while coke oven flue gas is the exhaust produced when that fuel burns in the battery heating walls, and the two streams need entirely different analytical frameworks.
Raw COG leaves the ovens at roughly 700-800 deg C and carries hydrogen, methane, carbon monoxide, C2+ hydrocarbons, tar vapor, BTX aromatics, naphthalene, hydrogen sulfide, and ammonia. It has a heating value of 17-19 MJ/Nm3, it is toxic, it is explosive in air between roughly 4% and 30% by volume, and it must pass through tar separation, ammonia washing, and desulfurization before firing. After the byproduct plant, the clean fuel keeps the hydrogen-rich character that defines its combustion behavior.
Coke oven flue gas is the gaseous exhaust produced when cleaned or raw coke oven gas is burned in the heating flues of a coke battery. It contains mainly nitrogen, water vapor, and carbon dioxide, with minor concentrations of oxygen, NOx, SO2, and solid particulates.
When the fuel enters the heating flues, combustion converts the energy carriers into stable products: sulfur species oxidize to SO2, the combustion air nitrogen passes through largely unchanged, and the hydrogen fraction becomes water vapor. The resulting stream is dominated by inert gas, and this is the stream on which environmental compliance is measured.
Fuel gas at 17-19 MJ/Nm3 with H2 at 50-60% and CH4 at 25-30%; toxic, explosive, and cleaned in the byproduct plant before use.
Stack gas at 180-300 deg C with N2 at 66-72%, H2O at 15-20%, and CO2 at 6-9%; carries NOx, SO2, and particulates to the treatment train.
Cleaned coke oven gas comprises roughly 50-60% hydrogen, 25-30% methane, 5-10% carbon monoxide, 2-3% carbon dioxide, 2-5% nitrogen, and 1-3% higher hydrocarbons and trace gases by volume.
The chart below shows a representative cleaned COG mixture. The H2-to-CH4 ratio of roughly 2:1 is the most important fuel value because it controls flame temperature, water vapor production, and NOx formation in the heating flues.
The trace components matter more than their volume suggests:
H₂S at 100-500 mg/Nm3 in cleaned COG converts almost entirely to SO₂ in the flue gas.
Residual NH3 above 50 mg/Nm3 becomes fuel-bound nitrogen and raises the NOx baseline.
Tar mist and naphthalene carry carbon particles into the flame and create deposit risks on heat-transfer surfaces.
When coke oven gas is fired with 5-15% excess air, the flue gas contains approximately 66-72% nitrogen, 15-20% water vapor, 6-9% carbon dioxide, and 1.5-4% oxygen on a wet basis, with NOx at 100-350 mg/Nm3 and particulates at 10-80 mg/Nm3.
| Parameter | Wet basis | Dry basis | Notes |
| N2 | 66-72% | 77-82% | From combustion air nitrogen |
| H2O | 15-20% | n/a | From H2 and CH4 combustion |
| CO2 | 6-9% | 7.5-10.5% | From carbon in the fuel |
| O2 | 1.5-4% | 1.8-4.5% | Excess-air control range |
| NOx | 100-350 mg/Nm3 | 100-400 mg/Nm3 | Mainly NO, thermal origin |
| SO2 | 20-120 mg/Nm3 | n/a | Depends on H2S slip |
| Particulates | 10-80 mg/Nm3 | n/a | Fines carry-over and sulfate aerosol |
NOx forms through three pathways in a COG flame. Thermal (Zeldovich) NOx dominates because the hydrogen-rich flame reaches high adiabatic temperatures. Prompt NOx forms in the thin post-flame zone where hydrocarbon radicals react with nitrogen, and fuel NOx appears whenever ammonia or HCN survives the byproduct plant. In a well-run battery, thermal NOx accounts for more than 80% of the total.
At 15-20% water vapor, even 5-10 mg/Nm3 of SO3 pushes the acid dew point above 130 deg C. Any surface below that temperature - economizer tubes, baghouse hoppers, ID fan blades - condenses sulfuric acid and corrodes.
Each measured component of the flue gas dictates a specific treatment decision: particulate loading selects the dust collector, SO2 selects the desulfurization reagent and material grade, NOx selects the SCR catalyst volume, and water vapor dictates temperature management.
Dust loadings of 10-80 mg/Nm3 at flue gas temperatures of 180-300 deg C are normally handled by a pulse-jet baghouse. PPS felt is the default media; PTFE membranes are added when SO2 loading raises the acid dew point close to the operating temperature. The available guidance on bag filter selection for industrial flue gas shows how media choice follows the gas analysis readout.
 Low-Pressure Pulse Jet Bag Dust Collector for High-Temperature Flue GasThis baghouse handles dust loads up to 80 mg/Nm3 at 180-300°C, using PPS felt or PTFE membranes for acid dew point conditions, ensuring outlet emissions below 8 mg/Nm3.View Product →
A wet desulfurization tower removes SO2 but saturates the stream with moisture and generates submicron sulfate mist. A downstream vertical honeycomb wet electrostatic precipitator removes those droplets; without it, opacity limits are missed even when the mass-based dust reading is under the limit. Anhui Tiankang Environmental Technology Co., Ltd., an industrial flue gas treatment system supplier, provides this wet ESP configuration for coking plants that need a low-risk compliance path for the complete flue gas train.
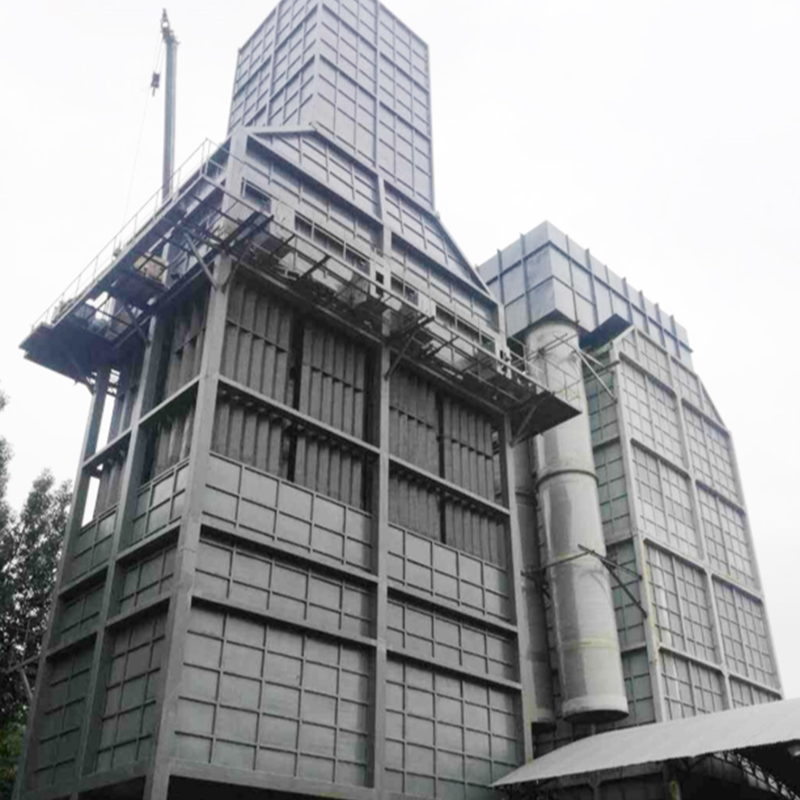 Vertical Honeycomb Wet Electrostatic Precipitator for Saturated GasPositioned after a wet desulfurization tower, this wet ESP removes submicron sulfate mist and moisture, achieving outlet dust below 5 mg/Nm3 to meet opacity limits reliably.View Product →
SO2 at 20-120 mg/Nm3 is normally removed with a limestone-gypsum or ammonia-based scrubber. The composition data drives material specification more than reagent chemistry: chloride and SO3 content determine whether carbon steel, fiber-reinforced plastic, or C276-clad internals are required in the outlet duct and stack.
The SCR reactor is sized from the inlet NOx, O2, and H2O values. Water vapor at 15-20% competes with NOx for active sites on the vanadium-based catalyst, so the volume must be corrected for actual flue gas humidity instead of air-fired boiler defaults. An O2 reading of only 1.5-4% keeps the catalyst active but slows the NO reduction rate at the lower end of the range.
The battery stack is not the only emission point. Coal receiving, belt conveyors, coke pushing, and oven door leaks generate intermittent dust plumes that are cheaper to capture than to clean after the fact. A belt-enclosed hood at each transfer point, ducted to a central baghouse, keeps pulverized coal dust out of the workplace atmosphere and off the battery roof.
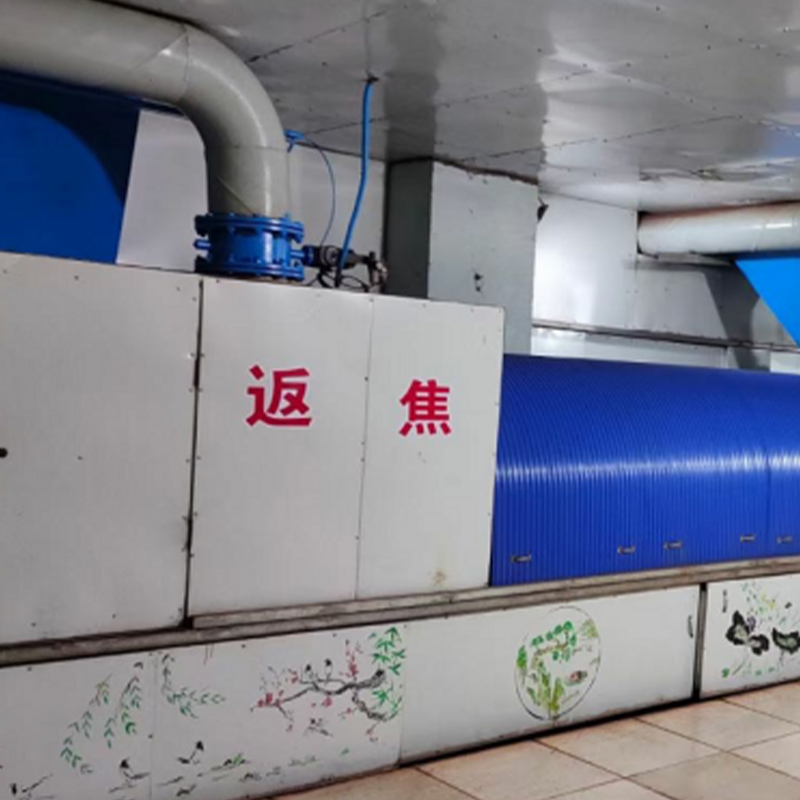 Belt Enclosed Hood for Conveyor Dust CaptureA full enclosure with soft side connections that adapts to belt width and sag, capturing coal dust at transfer points and preventing workplace plumes, ducted to a central baghouse.View Product →
The treatment train is a mirror of the measurement sheet. If the flue gas analysis lacks SO3, ammonia slip, or condensed mist data, the design will miss the wet ESP, the corrosion-resistant lining, or the SCR bypass - and retrofits are always more expensive than the original installation.
A defensible design basis starts with a stack test that measures dry gas composition, moisture, NOx, SO2, SO3, and particulates at the battery stack over at least two complete coking cycles, including the charging and pushing peaks.
Map the sampling grid at the stack according to US EPA Method 1 so each traverse point represents an equal area of the flue.
Run isokinetic particulate sampling with US EPA Method 5 or 17 to catch coarse carry-over and condensable material.
Analyze O2, CO2, CO, and NOx continuously with an extractive analyzer calibrated for the expected moisture level.
Trap SO2 and SO3 separately; the controlled condensation method prevents SO3 from absorbing into condensed water.
Measure moisture and acid dew point directly with an equilibrium probe instead of calculating water vapor from the fuel analysis alone.
Validate every measured value against an hourly fuel-gas mass balance; a gas analysis that does not match the fuel input is wrong regardless of the analyzer calibration certificate.
Do not average the stack test without separating the coking phases. NOx during charging and pushing can reach 1.5 to 2 times the battery-average value, and a design basis built on the average will fail the permit test in the first week.
Coke oven gas is a hydrogen-rich fuel produced during coal carbonization, while coke oven flue gas is the combustion exhaust from firing that fuel in the battery heating flues. The fuel is toxic and explosive; the flue gas is inert but carries NOx, SO2, and particulates that require treatment.
Coke oven flue gas contains roughly 6-9% CO2 on a wet basis and 7.5-10.5% on a dry basis, depending on the excess air ratio and the methane content of the fuel gas.
Hydrogen makes up 50-60% of cleaned coke oven gas. When it burns, one volume of H2 produces one volume of water vapor, while methane produces two volumes per volume of fuel. Together they push the flue gas moisture to 15-20%.
Yes, unless the coke oven gas is fully desulfurized upstream. Even after the gas plant, some H2S slip remains and oxidizes to SO2 in the heating flues, typically producing 20-120 mg/Nm3 SO2 in the flue gas.
Bottom line: the flue gas composition sheet is the blueprint for every emission control investment at a coking plant. Measure it before you size anything.